nigglette5
India

We have a range of concepts from the field of technology, statistics, data science and so on. We require to convert these concepts into interesting visuals/cartoons that convey the essence. The designs should be sophisticated, futuristic, subtle and niche The design needs to be of high quality and flexible enough to be used in multiple ways.
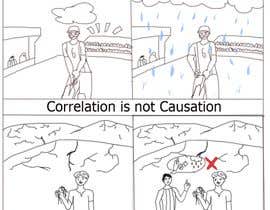
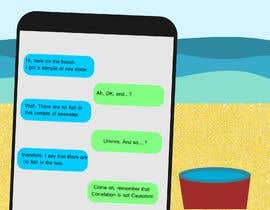
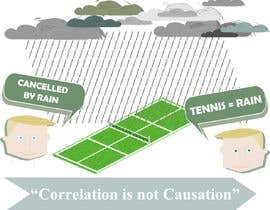
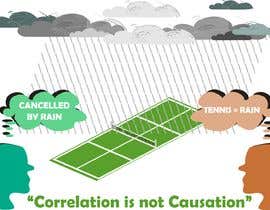
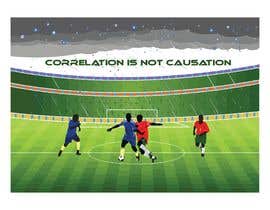
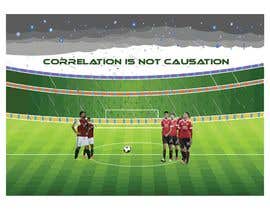
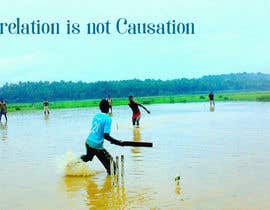
One example of Concept: Correlation is not Causation
Context that needs to be converted into visual: Many cricket matches (could be football or any other popular sport as well) get cancelled because of rain. But organizing a cricket match so that you want rain is wrongly interpreting correlation as causation and is incorrect. A cartoon around this with a text message that “Correlation is not Causation!” The final designs should be of high resolution e.g. 2400* 2400 and 300 dpi
In case of any queries, please feel free to contact me anytime at bharathvaid@gmail.com
Elaborating on the requirement. The design needs to illustrate the principle that “Correlation is not Causation”
For example - A person sees that football matches are being cancelled because of rain and creates a false mental picture that if he wants rain, he needs to organize a football match. The requirement is to bring this out in the form of a visual.


콘테스트 등록 신속하고 간편한 절차

응모작 접수 세계적인 참가 범위

최우수 응모작 선정 자료 파일의 다운로드(초간단!)